+86 18560646018

Views: 215 Author: Focus Color Publish Time: 2026-10-20 Origin: Site


Content Menu
● Liquid Crystal Sheet vs. Thermographic Cameras: A Practical Comparison
● How a Liquid Crystal Sheet Works in Physics Experiments
>> Temperature Changes the Reflected Color
>> The Active Temperature Range Matters
● How Thermographic Cameras Work in Educational Labs
>> Infrared Detection Produces a Thermal Image
>> Surface Properties Influence the Reading
● Which Technology Is More Accurate?
>> Liquid Crystal Sheet Accuracy Requires Calibration
>> Camera Sensitivity Is Not Measurement Accuracy
● Which Educational Physics Experiments Suit Each Method?
>> Heat Conduction Across a Surface
>> Insulation and Cooling Experiments
>> Evaporation, Convection, and Radiation
● Practical Experiment: Compare Both Tools on the Same Plate
>> Questions for Student Analysis
● Expert Insight: Three Mistakes That Weaken Classroom Results
>> Mistake 1: Comparing Colors Instead of Temperatures
>> Mistake 2: Ignoring Contact and Stabilization
>> Mistake 3: Treating the Measuring Tool as Invisible
● Purchasing and Customization: What Schools Should Specify
>> Compare Total Classroom Value
>> Define the Liquid Crystal Sheet Application First
● Choose the Tool Around the Learning Objective
>> Can a liquid crystal sheet replace a thermographic camera?
>> Do liquid crystal sheets provide exact temperature readings?
>> Why does a liquid crystal sheet turn black?
>> Can students photograph liquid crystal sheets with a phone?
>> Are thermographic cameras reliable on shiny metal?
>> Which option is better for introductory physics?
A liquid crystal sheet and a thermographic camera can both make temperature patterns visible, but they create very different learning experiences. In educational physics lab experiments, liquid crystal sheets place a color-changing indicator directly on a surface. Thermographic cameras detect infrared radiation remotely and convert it into a thermal image.
The practical choice depends on what students need to learn. For hands-on demonstrations of conduction and temperature gradients, liquid crystal sheets offer a direct, accessible starting point. For remote observation, wider temperature coverage, and digital analysis, thermographic cameras provide greater flexibility.
At Qingdao Focus On Color Industry & Trade Co., Ltd., our manufacturing background includes more than 13 years of experience with color-changing products, alongside OEM/ODM and personalized customization services. From this product-development perspective, the important question is not which technology looks more advanced. It is which measurement method best matches the experiment.

| Comparison factor | Liquid crystal sheet | Thermographic camera |
|---|---|---|
| Operating principle | Reflects different visible wavelengths as temperature changes | Detects infrared radiation and calculates apparent surface temperature |
| Relationship with the object | Usually requires thermal contact with the test surface | Observes remotely without attaching a sensor |
| Temperature coverage | Limited to the selected formulation's active range | Depends on the camera model and measurement mode |
| Visual output | Color patterns on the sheet itself | A screen image with an assigned color palette |
| Quantitative measurements | Requires color–temperature calibration | Requires appropriate settings and measurement conditions |
| Main error sources | Contact quality, lighting, viewing angle, calibration | Emissivity, reflections, focus, distance, target size |
| Recording | Visible-light photographs or video | Thermal images; radiometric recording depends on the model |
| Classroom logistics | Suitable for distributed tabletop activities | Often organized as a shared imaging station |
| Strongest teaching application | Local heat transfer and calibration | Remote temperature mapping and measurement limitations |
Neither technology directly measures heat flow. Both provide temperature-related information from which students can investigate heat-transfer behavior.
Thermochromic liquid crystals have temperature-dependent optical properties. Within their active range, changes in molecular organization alter the wavelengths of light they selectively reflect.
Many educational sheets show a sequence progressing from red toward green and blue as temperature rises. However, the exact sequence, usable range, and interpretation must come from the specific product.
These colors are reflected light, not light generated by the sheet. Consequently, illumination and viewing geometry affect what students see.
A liquid crystal sheet does not display useful temperature colors across every possible condition.
Below or above its active range, a sheet may appear dark rather than showing a meaningful temperature pattern. A dark region therefore does not automatically mean "cold."
For a classroom handprint activity, select a range that students can activate under actual room conditions. For a warmed-plate experiment, choose a formulation suited to the expected plate temperatures.
This selection step is fundamental: an unsuitable activation range can make a sound experiment appear unsuccessful.
A thermographic camera detects infrared radiation reaching its sensor. Its measurement system uses this signal, together with relevant settings, to estimate apparent surface temperature.
The displayed colors are a software palette. They are not the natural colors of the object.
Students should distinguish between:
- The infrared radiation detected by the instrument.
- The temperature values calculated from that signal.
- The palette used to display those values.
Changing the palette does not change the underlying temperature distribution.
Emissivity describes how effectively a surface emits thermal radiation compared with an ideal blackbody.
Shiny metals can reflect radiation from surrounding objects into the camera. An apparently hot region may therefore be a reflection rather than a genuinely hotter location.
Camera operation should include discussion of emissivity, reflected apparent temperature, focus, and measurement distance—not simply pointing the device at an object and accepting the number.
There is no defensible universal answer without specifying the sheet, camera, calibration procedure, surface, and experimental conditions.
For quantitative liquid crystal thermography, students must establish the relationship between color and temperature.
A useful calibration controls:
1. The reference temperature measurement.
2. Illumination and viewing angle.
3. Thermal contact with the calibration surface.
4. Time allowed for stabilization.
5. The image-capture settings used during analysis.
A narrow active range can make small changes visually distinguishable. That does not, by itself, establish absolute temperature accuracy.
A camera may distinguish small temperature differences while still having a larger uncertainty in absolute temperature.
Before purchasing equipment, examine the manufacturer's specifications for:
- Absolute accuracy and its operating conditions.
- Thermal sensitivity.
- Detector resolution.
- Minimum focusing distance.
- Radiometric image export.
For either method, teach students to compare readings with a suitable reference thermometer and report uncertainty. A precise-looking display is not proof of an accurate result.
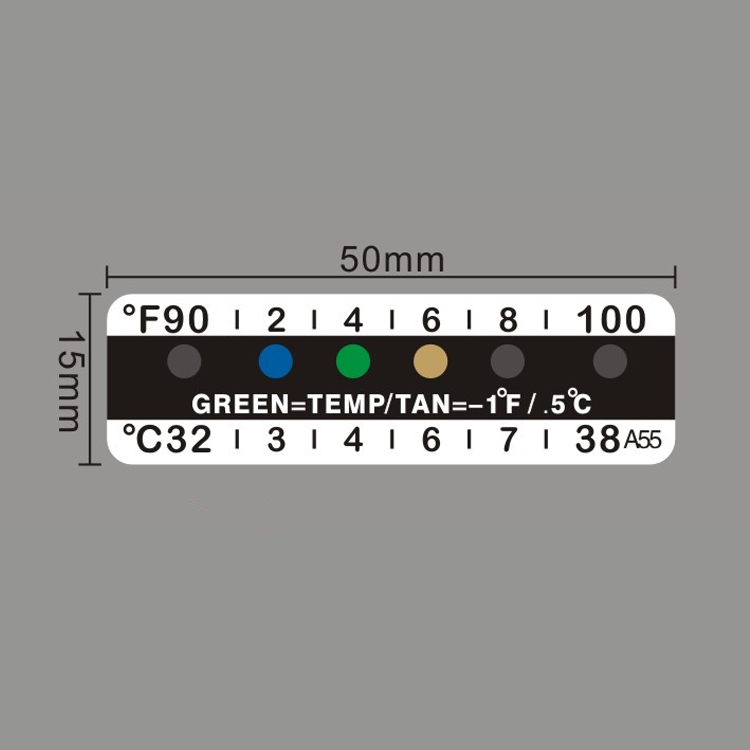
Liquid crystal sheets are particularly useful when students need to see a local temperature pattern develop directly on a surface.
A warmed object can create a changing color pattern, while different supporting materials alter how quickly the pattern fades.
A thermal camera can extend this investigation by observing several objects or regions without attaching an indicator to each one.
However, the sheet becomes part of the experimental assembly. Its backing, adhesive, and contact quality may affect the behavior being studied.
Both methods can support comparisons of insulation and cooling.
Sheets work best when the observed temperatures remain within their active range. Cameras allow remote comparison, but surface emissivity and reflections must be controlled.
An important teaching distinction is that a temperature map alone does not establish thermal conductivity. Geometry, thickness, heating conditions, and boundary conditions also influence the result.
Thermal cameras are useful for observing accessible surface-temperature changes associated with evaporative cooling or uneven heating.
They do not automatically make ordinary room-temperature air currents visible. Most classroom thermal images show surfaces, not a direct map of the air temperature between them.
Liquid crystal sheets can reveal the surface response to airflow or cooling, provided the response remains within their working range.
This proposed classroom investigation helps students compare measurement methods rather than merely admire colorful images.
Use:
- A small metal plate with protected edges.
- A liquid crystal sheet selected for the intended temperature range.
- A thermal camera.
- A suitable reference thermometer or surface probe.
- A controlled, low-temperature heat source.
- A visible-light camera and timer.
The instructor should set safe temperature limits and follow the equipment instructions. Keep electrical equipment away from water and avoid uncontrolled heating.
1. Allow the apparatus to reach room conditions.
2. Establish a fixed viewing position and stable illumination.
3. Record the plate's initial temperature.
4. Apply gentle heating at a defined location.
5. Capture sheet photographs and thermal images at regular intervals.
6. Record reference temperatures at identified positions.
7. Stop heating and observe the cooling phase.
8. Repeat the experiment under the same conditions.
When imaging the sheet with the thermal camera, recognize that the camera observes the exposed sheet surface—not the metal hidden beneath it.
For a bare-metal comparison, use a separate controlled trial and address emissivity appropriately.
Ask students:
- When does each method first reveal a change?
- Which regions fall outside the sheet's active range?
- Does the apparent pattern change with viewing angle?
- How closely do readings agree with the reference?
- Which observations are qualitative, and which are quantitative?
The strongest conclusion may be that the methods answer different questions rather than that one "wins."
Blue on a liquid crystal sheet and blue on a thermal camera do not necessarily represent the same temperature.
Sheet colors depend on the material's optical response. Camera colors depend on its selected palette and display scale.
For comparisons over time, keep the camera scale fixed where practical and retain the sheet's calibration conditions.
A sheet indicates its own temperature after exchanging heat with its surroundings and the contacted object.
Air gaps, inconsistent pressure, or incomplete stabilization can produce misleading patterns.
Students should document attachment methods and distinguish transient behavior from a stabilized reading.
Attaching a sheet can alter the surface assembly. Applying a reference patch for infrared measurements can also change local surface properties.
This creates an excellent advanced lesson: measurement methods can influence the system being measured.
Experimental design should identify these effects rather than hide them.
Avoid comparing only the purchase price of one sheet with one camera.
A more useful procurement question is: how many groups can complete the intended activity within one lesson?
Include:
- Number of active student stations.
- Replacement materials and handling requirements.
- Calibration time.
- Camera charging and software needs.
- Data-export requirements.
- Teacher preparation and student training.
Sheets may suit parallel group activities, while a camera can serve as a shared investigation station. Actual value depends on local quotations and lesson design.
For an OEM/ODM inquiry, provide the intended experiment rather than only requesting a generic "heat-sensitive sheet."
Useful specifications include:
- Expected surface-temperature range.
- Required sheet dimensions.
- Substrate and attachment method.
- Viewing and lighting conditions.
- Whether the activity is qualitative or quantitative.
- Expected handling, cleaning, and storage conditions.
Qingdao Focus On Color Industry & Trade Co., Ltd. can use these application details to discuss customization requirements. Final specifications, performance claims, and acceptance criteria should be confirmed against the proposed product—not assumed from the broader product category.
Choose a liquid crystal sheet when the priority is a visible, contact-based investigation within a defined temperature range. Choose a thermographic camera when remote observation and digital thermal analysis are central.
For a customized educational liquid crystal sheet, send Qingdao Focus On Color Industry & Trade Co., Ltd. your target temperature range, dimensions, attachment requirements, and experiment outline. Request a sample evaluation before confirming a larger order so the material can be assessed under actual classroom conditions.

For some contact-based demonstrations, yes. It cannot replace every camera function, particularly remote observation or measurements beyond its active temperature range.
Not automatically. Quantitative readings require calibration under controlled conditions. Without calibration, interpret the colors primarily as qualitative temperature indicators.
Depending on the product, it may be below or above its active range. Check the specified temperature response before interpreting a dark area.
Yes, for documentation and potentially calibrated analysis. Keep lighting, viewing angle, exposure, and white balance consistent to reduce changes unrelated to temperature.
Shiny metal presents measurement challenges because of low emissivity and reflected radiation. Use an appropriate measurement procedure rather than accepting the displayed temperature uncritically.
Sheets are a practical starting point for direct, hands-on visualization. Cameras add value when students need remote imaging, digital records, or lessons about infrared measurement.
1. "The Basics and Issues of Thermochromic Liquid Crystal Calibrations." *Experimental Thermal and Fluid Science*. Supports the need to calibrate color against temperature for quantitative measurements. [sciencedirect]
2. FLIR. "Thermographic Measurement Techniques." Technical guidance on emissivity, reflected apparent temperature, and reference-surface measurement procedures. [support.flir]
3. FLIR. "How Does Emissivity Affect Thermal Imaging?" Explains emissivity and reflected radiation, including the difficulty of measuring reflective surfaces. [flir]
4. TeachEngineering. "Liquid Crystal Thermometers." Educational activity covering liquid crystal temperature indicators, formulation selection, and testing the detectable temperature range. [teachengineering]
5. Arbor Scientific. "Liquid Crystal Sheet Demos." Classroom examples involving touch, insulation, and thermal conductivity. [arborsci]
6. *Electronics Cooling*. "Making Surface Temperature Measurements Using Liquid Crystal Thermography." Practical guidance on material selection, surface preparation, optical arrangements, and calibration. [electronics-cooling]
7. FLIR. "Using a Thermal Camera." Explains surface-temperature measurement and the influence of distance, ambient conditions, and emissivity. [docs.flir]


